Extreme Weather Events Dashboard
During the summer of 2023, I worked as a data science intern at ClimateAi, a company dedicated to assisting businesses and organizations in formulating long-term climate resilience strategies through various AI-based services.
I built a comprehensive extreme weather events dashboard, which contains various key attributes (e.g., type of extreme weather events, location, time, crops impacted, quantitative impact) of heatwaves, droughts, hurricanes, and other kinds of extreme weather events happening worldwide.
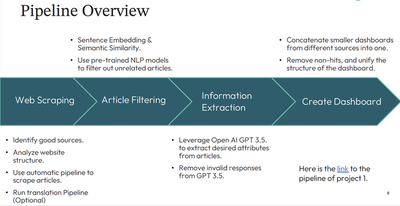
There are four main components in the end-to-end pipeline: Web Scraping ⇒ Article Filtering ⇒ Information Extraction ⇒ Creating the Dashboard.
Stage 1 - Web Scraping
- This stage is to scrape publicly available articles from the internet.
- Data Source: 80,000+ articles (e.g., United Nations).
- Tech Stack: BeautifulSoap and Selenium.
Stage 2 - Article Filtering
- This stage is to filter out the irrelevant articles.
- Article Filtering Approaches
- Approach 1 - Stemming and Keywords Matching
- Approach 2 - Directly Use Pretrained NLP Models
- Approach 3 - Sentence Embedding & Similarity [Preferred]
- Accuracy - 95%
Stage 3 - Information Extraction
- This stage leverages OpenAI LLMs API and prompt engineering to extract the key attributes from the structured textual data into relatively structured insights.
- OpenAI API - GPT-3.5-turbo
Stage 4 - Creating the Dashboard
- This stage is the final stage for the creation of the final dashboard, including concatenating the smaller dashboards from different data sources, cleaning & structuring the dashboard, and adding new features for better visualization (e.g., filters based on specific values of an attribute).
Zijian Zhang
Software Engineer
My career interests include software engineering, data science, and machine learning.